What 150 income statements told us
$100 versus $400.
Two groups emerged from the data.
Every time a company in the lower group earned $100, a company in the top group earned $400.
For the same work. Same services. Same labor market. Same weather.
The gap is not a verdict. It is an invitation. The Benchmark Report shows you where your company sits and what it would take to close it.
The industry is moving. Are you moving with it?
Companies in the 12th Annual Report
$2.3B
Combined Revenue
Employees represented
%
Operating above 10% profit margin*
*Up from 24% five years ago
Made possible by our sponsors

No Excuses
It is not your size. It is not your market. It is not your mix.
Companies above 10 percent showed up everywhere we looked.
Every size.
From under $2.5 million to over $40 million.
Every region.
Northeast to Northwest, and Canada.
Every mix.
Maintenance, construction, or a blend of both.
The difference is not circumstance. It is execution.
Ten points apart. Here is where they go.
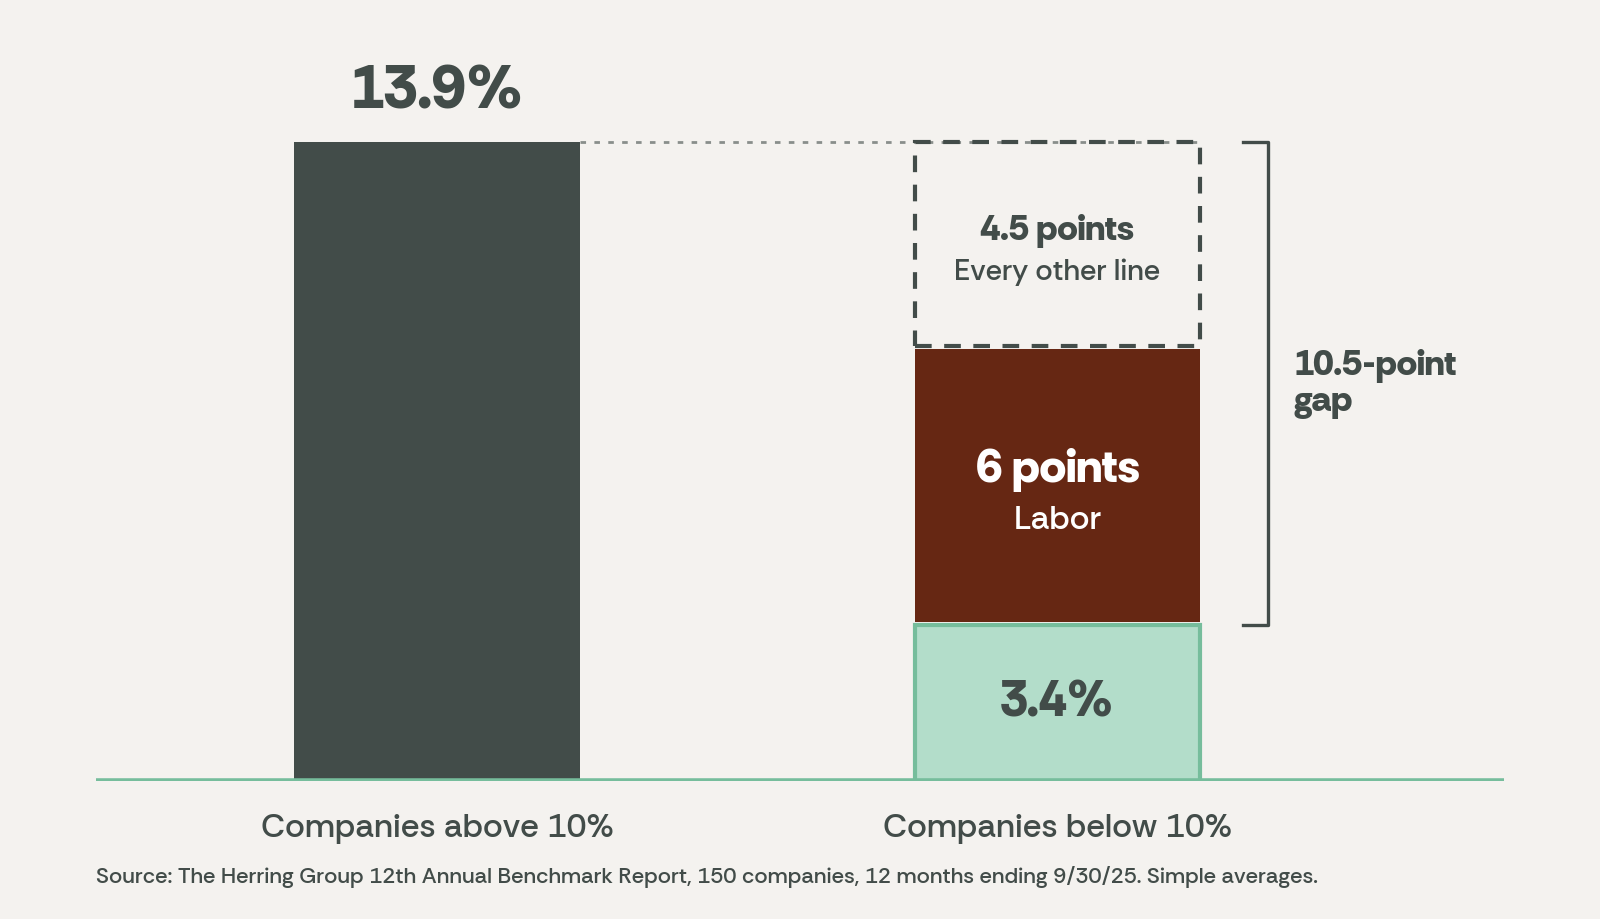
Companies above 10 percent averaged 13.9 percent operating profit margin. Companies below averaged 3.4 percent.
Six of those ten points live in labor. The rest hide in every other line of the income statement. Vehicles. Overhead labor. Insurance. A tenth of a point here. Two tenths there.
No single bad decision. A hundred small leaks.
The Benchmark Report shows you which lines are leaking in your business, compared to companies that look like yours.
How It Works
Ten minutes of your time. Hundreds of hours of ours.
Step 1: Join The Report
Your purchase of The Herring Group’s 13th Annual Peer Benchmark Report secures your spot. $347 with a 60-day no-risk guarantee.
STEP 2: Upload two documents
Upload your income statement and balance sheet for the twelve months ending September 30, 2026. It takes fewer than ten minutes. Data is due November 5, 2026.
Step 3: We do the Work
Our financial leaders review and recode every statement so the numbers truly compare. We check depreciation against every balance sheet and adjust it where needed.
STEP 4: Receive your report and company number
You will get the full report and a private company number in early December. The numbers remain anonymous, but the filters allow for comparisons.
Step 5: Join two live webinars
In December, Greg Herring and Sara Gonzales walk through the findings and show you how to run your own comparison. In January, we go deeper with the high performers.
A note on privacy
Every company is anonymous. You see every participant's percentages. No one sees your name, and your numbers stay private.
Not an industry average. Your average.
Most benchmarks hand you one number and call it the industry. We hand you every company's percentages and let you build your own comparison.
- Filter out companies with snow
- Filter by construction mix
- Remove companies too large or too small to compare
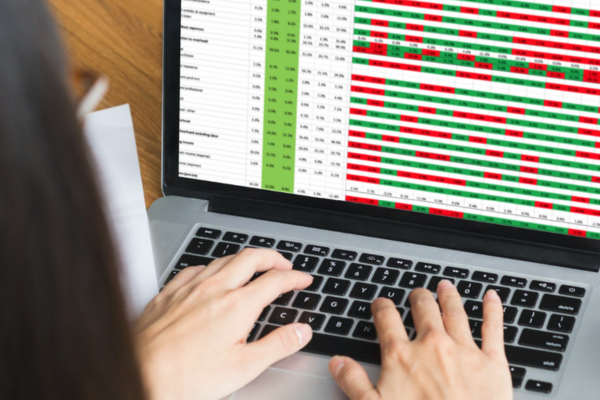
- See green where you beat your peers and red where you trail them
You see every participant. No one sees your name.
A message from Greg
Why I build this report every year
This is our 13th year building the Benchmark Report. Every December, I sit with the income statements of landscape companies and see the same thing. Two companies doing the same work, one keeping four times what the other keeps.
I do not show you that gap to shame anyone. I show it because the gap is where the opportunity lives. I have never worked with a company, no matter how well it performed, that did not have opportunity left on the table.
Profit is not the goal. It is what pays for your people's raises, their retirement, and their job security. It pays for your evenings and weekends. We call that life margin.
Join us this year, and let us show you where your margin is hiding.
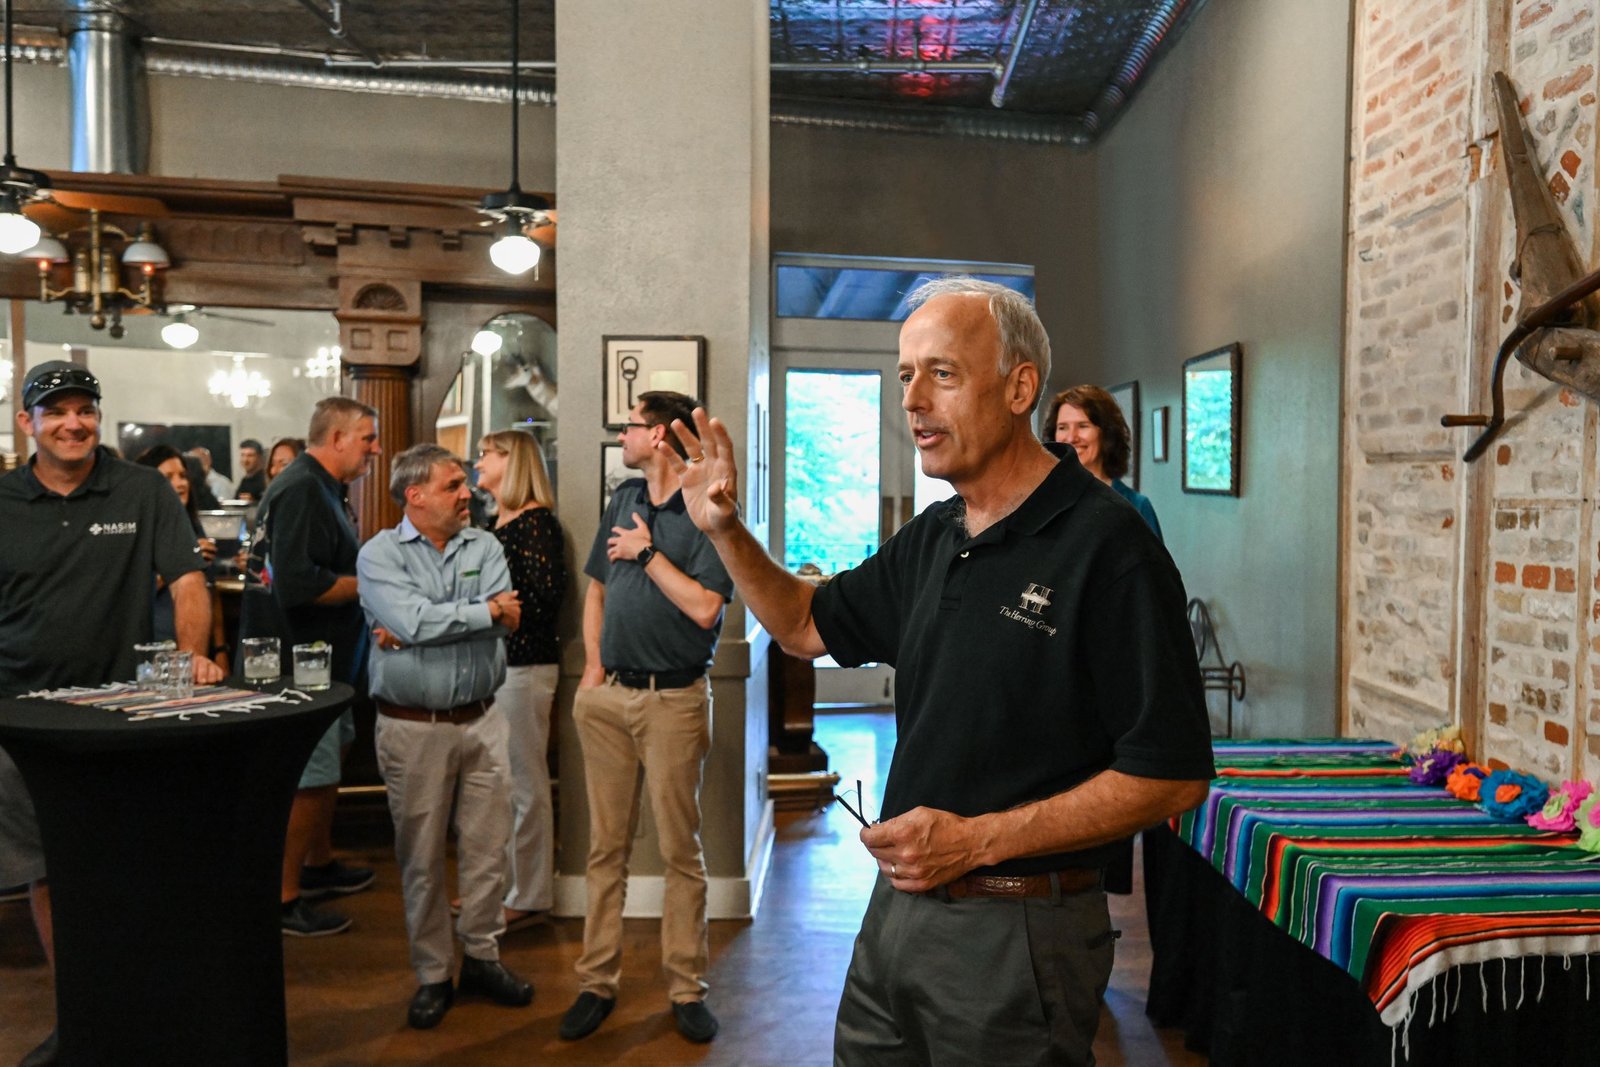
Greg Herring, Founder & CEO, The Herring Group
What is clarity worth?
One point of operating profit margin on a $5 million company is $50,000 a year.
- The 13th Annual Landscape Industry Benchmark Report
- Your private company number
- True peer filtering by size, snow, and construction mix
- December report review webinar
- January high-performer webinar
Value. Guaranteed.
Price: $347
Guarantee: 60-day no-risk guarantee. If you do not receive more value than you paid, ask for a refund.
Registration: Closes October 22, 2026
The more companies that participate, the better the report becomes for everyone. Know an owner who wants clarity? Send them this page.